1972 UK local election
1972 Liverpool City Council election
|
|
42 of 120 Councillors seats
to Liverpool City Council
81 of 120 Councillors and 40 Aldermen seats needed for a majority |
|---|
| |
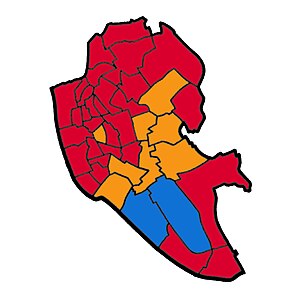 Map of Liverpool showing wards won (first placed party) [1] |
Elections to Liverpool City Council were held on 3 May 1972. One seat in each of the forty wards was up for election, plus one by-election seat each in Vauxhall and Woolton wards. This was the last year when the council comprised 120 councillors and 40 Aldermen, totalling 160, which was the largest council membership .
After the election, the composition of the council was:
| Party | Councillors | ± | Aldermen |
| | Labour | 73 | +18 | ?? |
| | Conservative | 29 | -24 | ?? |
| | Liberal | 14 | +7 | ?? |
| | Protestant | 3 | -2 | 0 |
Election result
Liverpool Local Election Result 1972 | Party | Seats | Gains | Losses | Net gain/loss | Seats % | Votes % | Votes | +/− |
| | Labour | 31 | 19 | 1 | +18 | 74% | 50% | 74,703 | |
| | Liberal | 8 | 7 | 0 | +7 | 19% | 16% | 23,549 | |
| | Conservative | 3 | 0 | 24 | -24 | 7% | 33% | 49,187 | |
| | Protestant | 0 | 0 | 2 | -2 | 0% | 1% | 1,494 | |
| | Communist | 0 | 0 | 0 | 0 | 0% | 0.6% | 934 | |
Ward results
This data is compared with the election results for 1969, when the councillors were elected for a three-year term.
* - Councillor seeking re-election
(PARTY) - Party of former Councillor
Abercromby
Abercromby | Party | Candidate | Votes | % | ±% |
| | Labour | W. F. Burke * | 871 | 79% | +35% |
| | Conservative | L. W. Mossford | 139 | 13% | -26% |
| | Communist | A. McClelland | 96 | 9% | -5% |
| Majority | 732 | | |
| Registered electors | 5,218 | | |
| Turnout | 1,106 | 21% | 0% |
| | Labour hold | Swing | | |
Aigburth
Aigburth | Party | Candidate | Votes | % | ±% |
| | Conservative | S. T. Moss * | 3,639 | 81% | -11% |
| | Labour | R. Fogg | 875 | 19% | +11% |
| Majority | 2,764 | | |
| Registered electors | 14,550 | | |
| Turnout | 4,514 | 31% | -5% |
| | Conservative hold | Swing | | |
Allerton
Allerton | Party | Candidate | Votes | % | ±% |
| | Conservative | W. S. D. Weaver (PARTY) | 2,509 | 68% | -2% |
| | Labour | P. T. Ash | 1,178 | 32% | +25% |
| Majority | 1,331 | | |
| Registered electors | 10,977 | | |
| Turnout | 3,687 | 34% | -5% |
| | Conservative hold | Swing | | |
Anfield
Anfield | Party | Candidate | Votes | % | ±% |
| | Labour | R. J. Short | 2,733 | 56% | +32% |
| | Conservative | J. Mass (PARTY) | 2,143 | 44% | -32% |
| Majority | 590 | | |
| Registered electors | 13,430 | | |
| Turnout | 4,876 | 36% | +6% |
| | Labour gain from Conservative | Swing | | |
Arundel
Arundel | Party | Candidate | Votes | % | ±% |
| | Liberal | C. Hutchinson | 2,093 | 44% | +25% |
| | Conservative | K. W. Edwards * | 1,368 | 29% | -33% |
| | Labour | A. L. Jones | 1,262 | 27% | +13% |
| Majority | 725 | | |
| Registered electors | 14,405 | | |
| Turnout | 4,723 | 33% | +2% |
| | Liberal gain from Conservative | Swing | | |
Breckfield
Breckfield | Party | Candidate | Votes | % | ±% |
| | Labour | T. Roberts | 1,197 | 41% | +13% |
| | Liberal | P. Chivall | 1,069 | 37% | +19% |
| | Conservative | D. J. Lewis (PARTY) | 625 | 22% | -32% |
| Majority | 128 | | |
| Registered electors | 8,243 | | |
| Turnout | 2,891 | 35% | +5% |
| | Labour gain from Conservative | Swing | | |
Broadgreen
Broadgreen | Party | Candidate | Votes | % | ±% |
| | Liberal | G. J. Palmer | 2,066 | 47% | +17% |
| | Conservative | D. J. Jones * | 1,330 | 30% | -27% |
| | Labour | L. Collins | 1,031 | 23% | +10% |
| Majority | 736 | | |
| Registered electors | 12,103 | | |
| Turnout | 4,427 | 37% | +6% |
| | Liberal gain from Conservative | Swing | | |
Central
Central | Party | Candidate | Votes | % | ±% |
| | Labour | G. G. Maloney * | 1,400 | 98% | +49% |
| | Conservative | S. V. Hennessy | 27 | 2% | -47% |
| Majority | 1,373 | | |
| Registered electors | 4,898 | | |
| Turnout | 1,427 | 29% | -7% |
| | Labour hold | Swing | | |
Childwall
Childwall | Party | Candidate | Votes | % | ±% |
| | Liberal | Anthony Limont | 3,641 | 45% | +27% |
| | Conservative | F. H. Andrews * | 3,376 | 42% | -31% |
| | Labour | R. McConnell | 1,068 | 13% | +6% |
| Majority | 265 | | |
| Registered electors | 18,947 | | |
| Turnout | 8,085 | 43% | +8% |
| | Liberal gain from Conservative | Swing | | |
Church
Church | Party | Candidate | Votes | % | ±% |
| | Liberal | Joseph Robert Wilmington | 3,058 | 52% | -3% |
| | Conservative | W. H. Stabback | 2,363 | 40% | -2% |
| | Labour | J. P. Connelly | 457 | 8% | +5% |
| Majority | 695 | | |
| Registered electors | 14,655 | | |
| Turnout | 5,878 | 40% | -8% |
| | Liberal hold | Swing | | |
Clubmoor
Clubmoor | Party | Candidate | Votes | % | ±% |
| | Labour | G. G. Pratt | 2,254 | 55% | +17% |
| | Conservative | A. L. Jones (PARTY) | 1,808 | 45% | -17% |
| Majority | 446 | | |
| Registered electors | 10,972 | | |
| Turnout | 4,062 | 37% | +1% |
| | Labour gain from Conservative | Swing | | |
County
County | Party | Candidate | Votes | % | ±% |
| | Labour | E. T. Mooney | 2,653 | 61% | +34% |
| | Conservative | H. Brown (PARTY) | 1,730 | 39% | -28% |
| Majority | 923 | | |
| Registered electors | 12,863 | | |
| Turnout | 4,383 | 34% | +2% |
| | Labour gain from Conservative | Swing | | |
Croxteth
Croxteth | Party | Candidate | Votes | % | ±% |
| | Liberal | K. W. Hart | 2,505 | 45% | +45% |
| | Conservative | A. L. Audley * | 2,051 | 37% | -50% |
| | Labour | T. Bouch | 1,043 | 19% | -+6% |
| Majority | 454 | | |
| Registered electors | 12,845 | | |
| Turnout | 5,599 | 44% | +10% |
| | Liberal gain from Labour | Swing | | |
Dingle
Dingle | Party | Candidate | Votes | % | ±% |
| | Labour | Mrs. M. Evans (PARTY) | 2,075 | 75% | +15% |
| | Conservative | J. McDermott | 605 | 22% | -15% |
| | Communist | J. Cook | 84 | 3% | 0% |
| Majority | 1,470 | | |
| Registered electors | 8,577 | | |
| Turnout | 2,764 | 32% | -6% |
| | Labour hold | Swing | | |
Dovecot
Dovecot | Party | Candidate | Votes | % | ±% |
| | Labour | W. H. Westbury (PARTY) | 3,402 | 70% | +9% |
| | Conservative | J. L. Walsh | 1,473 | 30% | -9% |
| Majority | 1,929 | | |
| Registered electors | 16,542 | | |
| Turnout | 4,875 | 30% | -3% |
| | Labour hold | Swing | | |
Everton
Everton | Party | Candidate | Votes | % | ±% |
| | Labour | T. McManus (PARTY) | 620 | 80% | +18% |
| | Conservative | R. S. Charles | 159 | 20% | -18% |
| Majority | 461 | | |
| Registered electors | 2,898 | | |
| Turnout | 779 | 27% | -2% |
| | Labour hold | Swing | | |
Fairfield
Fairfield | Party | Candidate | Votes | % | ±% |
| | Labour | H. Livermore | 1,578 | 40% | -4% |
| | Liberal | C. Crawford | 1,442 | 36% | +36% |
| | Conservative | E. Crierie | 960 | 24% | -32% |
| Majority | 136 | | |
| Registered electors | 11,380 | | |
| Turnout | 3,980 | 35% | +7% |
| | Labour gain from Conservative | Swing | | |
Fazakerley
Fazakerley | Party | Candidate | Votes | % | ±% |
| | Labour | A. Williams | 2,548 | 61% | +15% |
| | Conservative | A. Lloyd (PARTY) | 1,602 | 39% | -15% |
| Majority | 946 | | |
| Registered electors | 12,051 | | |
| Turnout | 4,150 | 34% | -2% |
| | Labour gain from Conservative | Swing | | |
Gillmoss
Gillmoss | Party | Candidate | Votes | % | ±% |
| | Labour | T. Higgins | 4,454 | 74% | +30% |
| | Conservative | G. Smith (PARTY) | 1,057 | 17% | -33% |
| | Tenants' Association | C. Boyd | 433 | 7% | |
| | Communist | K. Dunlop | 109 | 2% | -4% |
| Majority | 3,397 | | |
| Registered electors | 20.132 | | |
| Turnout | 6,053 | 30% | +6% |
| | Labour gain from Conservative | Swing | | |
Granby
Granby | Party | Candidate | Votes | % | ±% |
| | Labour | Mrs. M. Simey * | 1,640 | 75% | +25% |
| | Conservative | L. D. Wollen | 484 | 22% | -24% |
| | Communist | J. V. Powell | 69 | 3% | -1% |
| Majority | 1,156 | | |
| Registered electors | 8,086 | | |
| Turnout | 2,193 | 27% | +1% |
| | Labour hold | Swing | | |
Kensington
Kensington | Party | Candidate | Votes | % | ±% |
| | Labour | C. Perry | 1,909 | 59% | +34% |
| | Conservative | J. G. Barrett * | 896 | 28% | -26% |
| | Liberal | Graham Hulme | 432 | 13% | +13% |
| Majority | 1,013 | | |
| Registered electors | 9,953 | | |
| Turnout | 3,237 | 33% | +4% |
| | Labour gain from Conservative | Swing | | |
Low Hill
Low Hill | Party | Candidate | Votes | % | ±% |
| | Liberal | David Alton | 1,061 | 55% | +55% |
| | Labour | V. McCoy | 666 | 34% | -5% |
| | Conservative | T. P. Pink * | 208 | 11% | -46% |
| Majority | 395 | | |
| Registered electors | 4,286 | | |
| Turnout | 1,935 | 45% | +16% |
| | Liberal gain from Conservative | Swing | | |
Melrose
Melrose | Party | Candidate | Votes | % | ±% |
| | Labour | B. Shaw * | 1,578 | 79% | +29% |
| | Conservative | A. J. Browne | 421 | 21% | -29% |
| Majority | 1,157 | | |
| Registered electors | 7,146 | | |
| Turnout | 1,999 | 28% | +4% |
| | Labour gain from Conservative | Swing | | |
Netherfield
Old Swan
Old Swan | Party | Candidate | Votes | % | ±% |
| | Liberal | W. M. Galbraith | 2,597 | 49% | +8% |
| | Labour | F. Keating | 1,368 | 26% | +12% |
| | Conservative | N. F. Derrick * | 1,358 | 26% | -19% |
| Majority | 1,229 | | |
| Registered electors | 13,581 | | |
| Turnout | 5,323 | 39% | +5% |
| | Liberal gain from Conservative | Swing | | |
Picton
Picton | Party | Candidate | Votes | % | ±% |
| | Labour | M. Aspin | 2,056 | 52% | +18% |
| | Conservative | Dr. Thomas Lyrian Hobday * | 1,133 | 29% | -33% |
| | Liberal | J. A. Gallagher | 655 | 17% | +17% |
| | Communist | J. G. Volleamere | 85 | 2% | +2% |
| Majority | 923 | | |
| Registered electors | 12,543 | | |
| Turnout | 3,929 | 31% | +3% |
| | Labour gain from Conservative | Swing | | |
Pirrie
Pirrie | Party | Candidate | Votes | % | ±% |
| | Labour | P. Owens | 3,902 | 68% | +28% |
| | Conservative | I. Balmer * | 1,829 | 32% | -28% |
| Majority | 2,073 | | |
| Registered electors | 16,374 | | |
| Turnout | 5,731 | 35% | +7% |
| | Labour gain from Conservative | Swing | | |
Prince's Park
Prince's Park | Party | Candidate | Votes | % | ±% |
| | Labour | Cyril Taylor * | 2,313 | 73% | +23% |
| | Conservative | M. Kingston | 748 | 24% | -20% |
| | Communist | J. F. Greig | 86 | 3% | -3% |
| Majority | 1,565 | | |
| Registered electors | 8,373 | | |
| Turnout | 3.147 | 38% | -8% |
| | Labour hold | Swing | | |
Sandhills
Sandhills | Party | Candidate | Votes | % | ±% |
| | Labour | V. P. Hyams * | 1,479 | 91% | +31% |
| | Conservative | R. Walsh | 139 | 9% | -27% |
| Majority | 1,340 | | |
| Registered electors | 5,295 | | |
| Turnout | 1,618 | 31% | +6% |
| | Labour hold | Swing | | |
St. Domingo
St. James
St. James | Party | Candidate | Votes | % | ±% |
| | Labour | E. Shields * | 2.512 | 82% | +31% |
| | Communist | R. O'Hara | 356 | 12% | -10% |
| | Conservative | F. Jones | 196 | 6% | -19% |
| Majority | 2,156 | | |
| Registered electors | 8,642 | | |
| Turnout | 3,064 | 35% | +2% |
| | Labour hold | Swing | | |
St. Mary's
St. Mary's | Party | Candidate | Votes | % | ±% |
| | Labour | S. R. Maddox | 2,362 | 65% | +33% |
| | Conservative | R. E. Lloyd * | 1,256 | 35% | -33% |
| Majority | 1,106 | | |
| Registered electors | 10,310 | | |
| Turnout | 3,618 | 35% | +3% |
| | Labour gain from Conservative | Swing | | |
St. Michael's
St. Michael's | Party | Candidate | Votes | % | ±% |
| | Liberal | C. Graham | 2,696 | 57% | +57% |
| | Conservative | R. M. Aymes (PARTY) | 1,277 | 27% | -54% |
| | Labour | F. W. Longworth | 700 | 15% | -4% |
| Majority | 1,419 | | |
| Registered electors | 10,712 | | |
| Turnout | 4,722 | 44% | +16% |
| | Liberal gain from Conservative | Swing | | |
Smithdown
Smithdown | Party | Candidate | Votes | % | ±% |
| | Labour | E. W. Gorman | 1,246 | 75% | +34% |
| | Conservative | J. W. Butler * | 282 | 17% | -37% |
| | Liberal | W. A. Bartels | 130 | 8% | +8% |
| Majority | 964 | | |
| Registered electors | 6,718 | | |
| Turnout | 1,658 | 25% | +7% |
| | Labour gain from Conservative | Swing | | |
Speke
Speke | Party | Candidate | Votes | % | ±% |
| | Labour | P. Moorhead | 3,634 | 73% | +29% |
| | Conservative | E. M. Clein * | 1,330 | 27% | -29% |
| Majority | 2,304 | | |
| Registered electors | 15,236 | | |
| Turnout | 4,964 | 33% | +11% |
| | Labour gain from Conservative | Swing | | |
Tuebrook
Tuebrook | Party | Candidate | Votes | % | ±% |
| | Labour | J. E. Roberts | 2,419 | 61% | +31% |
| | Conservative | D. E. Daniel (PARTY) | 1,563 | 39% | -31% |
| Majority | 856 | | |
| Registered electors | 11,786 | | |
| Turnout | 3,982 | 34% | +3% |
| | Labour gain from Conservative | Swing | | |
Vauxhall
Vauxhall 2 seats | Party | Candidate | Votes | % | ±% |
| | Labour | Mrs. C. O'Rourke (PARTY) | 1,312 | 93% | +25% |
| | Labour | G. R. Sullivan (PARTY) | 1,140 | 81% | +13% |
| | Liberal | J. J. Hastings | 69 | 5% | -20% |
| | Conservative | H. Davies | 32 | 2% | -2% |
| | Conservative | I. McFall | 28 | 2% | -2% |
| Majority | 1,243 | | |
| Registered electors | 5,866 | | |
| Turnout | 1,413 | 24% | +5% |
| | Labour hold | Swing | | |
| | Labour hold | Swing | | |
Warbreck
Warbreck | Party | Candidate | Votes | % | ±% |
| | Labour | E. Kelly | 1,931 | 52% | +31% |
| | Conservative | R. B. Flude (PARTY) | 1,786 | 48% | -31% |
| Majority | 145 | | |
| Registered electors | 12,333 | | |
| Turnout | 3,717 | 30% | -2% |
| | Labour gain from Conservative | Swing | | |
Westminster
Westminster | Party | Candidate | Votes | % | ±% |
| | Labour | J. Gardner | 1,401 | 71% | +29% |
| | Conservative | J. Wareing * | 569 | 29% | -29% |
| Majority | 832 | | |
| Registered electors | 5,779 | | |
| Turnout | 1,970 | 34% | +2% |
| | Labour gain from Conservative | Swing | | |
Woolton
Woolton 2 seats | Party | Candidate | Votes | % | ±% |
| | Labour | L. Evans (PARTY) | 4,834 | 50% | +8% |
| | Conservative | L. B. Williams (PARTY) | 4,771 | 50% | -8% |
| | Conservative | C. G. Hallows | 4,600 | 48% | -10% |
| | Labour | K. Simpson | 4,561 | 47% | +5% |
| Majority | 63 | | |
| Registered electors | 30,380 | | |
| Turnout | 9,605 | 32% | 0% |
| | Conservative hold | Swing | | |
| | Labour gain from Conservative | Swing | | |
[2] [3]
References


 Local elections in Merseyside


